Historique
Analysis → History
Important part in software : the historization part, a true memory of it. It is possible in Jeedom to log any information type command (binary or digital). This will allow you for example to log a temperature curve, consumption, door openings, etc

Principe
Here is described the principle of historicization of Jeedom. You only need to understand this if you are having historization issues or want to change the historization settings. Default settings are fine in most cases.
Archivage
Data archiving allows Jeedom to reduce the amount of data stored in memory. This allows not to use too much space and does not slow down the system. Indeed, if you keep all the measurements, this makes all the more points to display and therefore it can considerably lengthen the times to render a graph. If there are too many points, it may even cause the graph display to crash.
Archiving is a task that starts at night and compacts the data recovered during the day. By default Jeedom retrieves all older data of 2 hours and makes 1 hour packets of it (either an average, a minimum or a maximum depending on the settings). So here we have two parameters, one for packet size and another to know when to do it (by default, these are 1 hour packets with data that are more than 2 hours old).
Tip
If you have followed well you should have a high precision on the last 2 hours only. However when I connect at 5 p.m., I have a precision on the last 17 hours. Why ? In fact, to avoid consuming resources unnecessarily, the task of archiving takes place only once a day, in the evening.
IMPORTANT
Of course, this archiving principle only applies to digital type commands; on binary type commands, Jeedom keeps only the dates of change of state.
Viewing a graph
There are several ways to access the history :
- By clicking on the desired command in a widget,
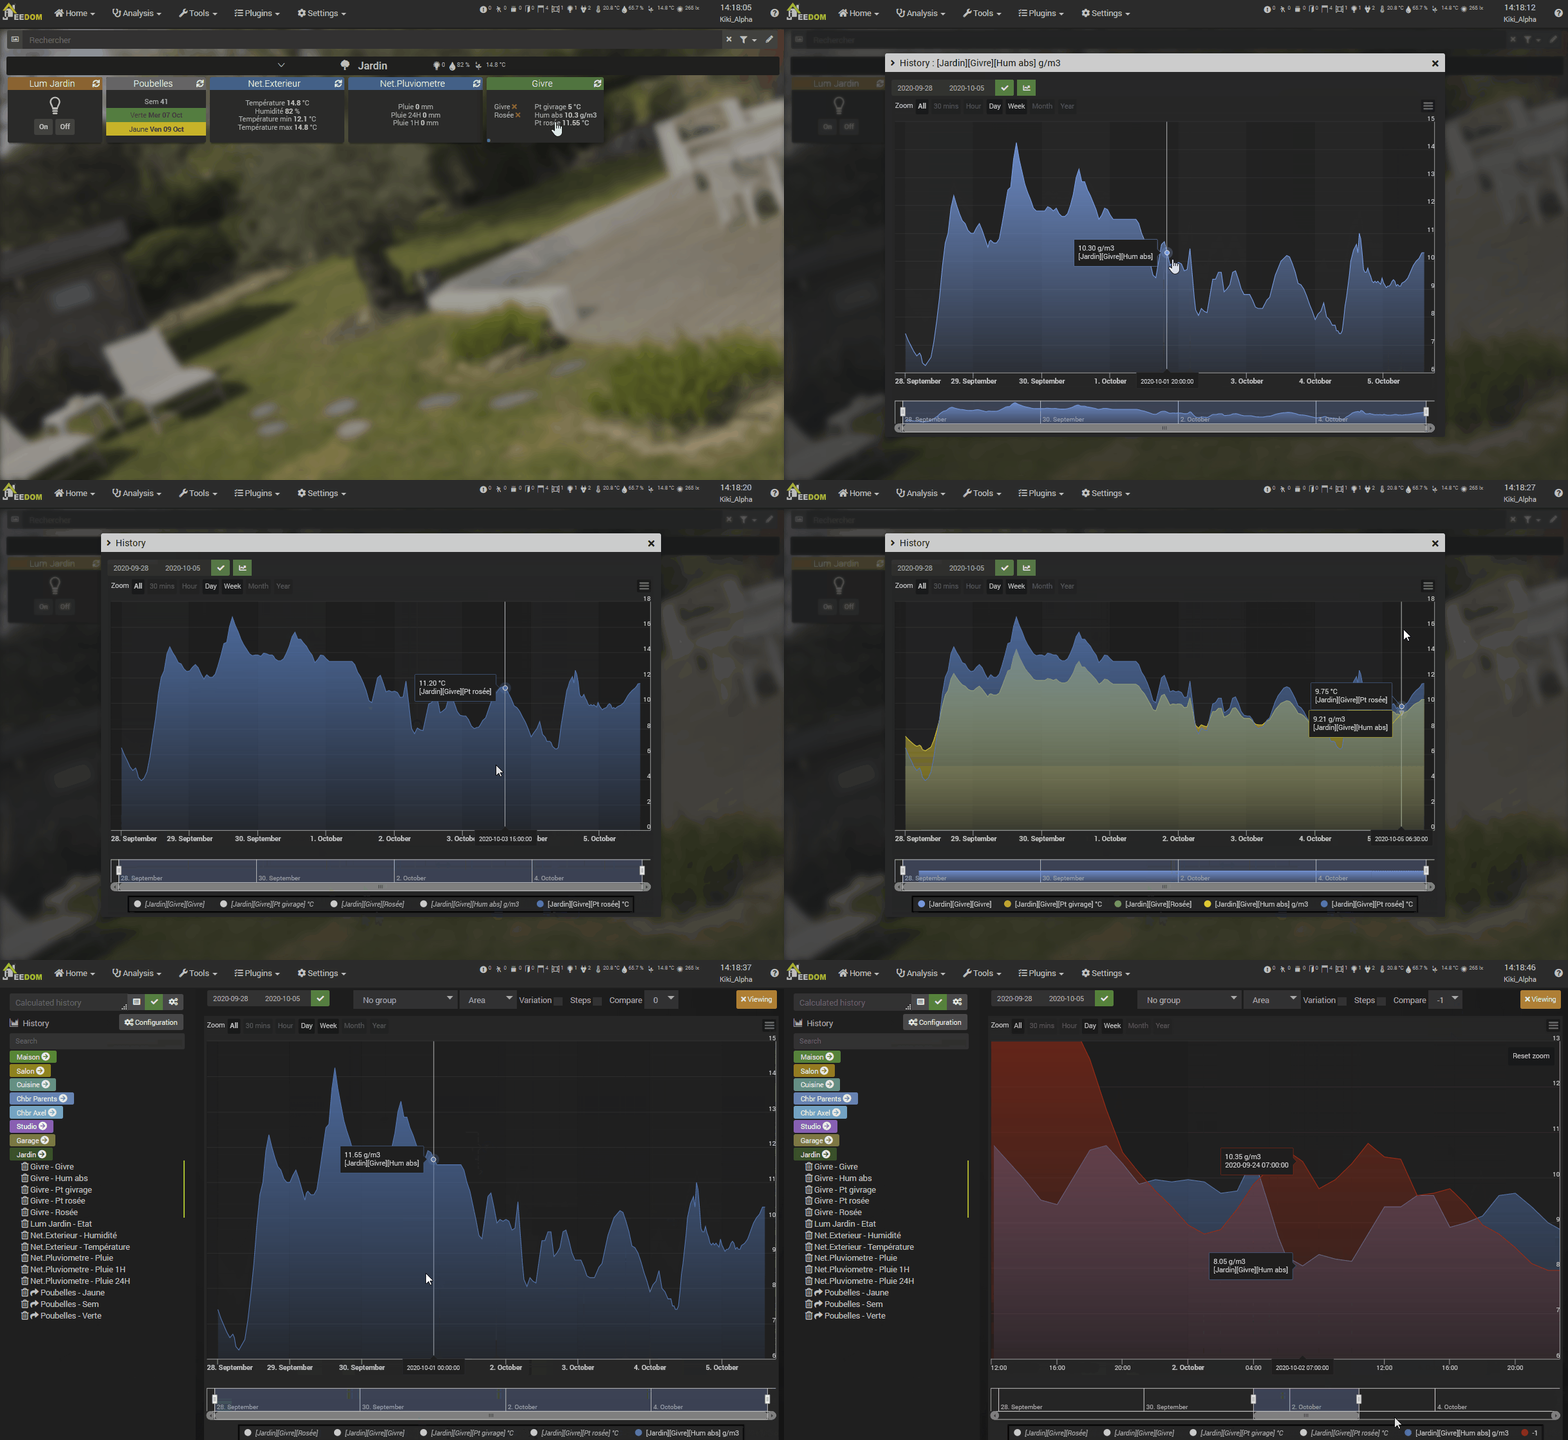
- By going to the history page which allows to superimpose different curves and to combine styles (area, curve, bar),
- On mobile while remaining pressed on the widget in question,
- By putting a graph area in a view (see below).
Historique
If you display a graph via the history page, you have access to several display options, above the graph :
- Period : The display period, including historical data between these two dates. By default, depending on the setting Display period graphics by default IN Settings → System → Configuration / Equipment.
- Group : Offers several grouping options (Sum per hour, etc.).
- Display type : Display in Line, Area, or Bar. Option saved on the order and used from the Dashboard.
- Variation : Displays the difference in value from the previous point. Option saved on the order and used from the Dashboard.
- Staircase : Displays the curve as a staircase or a continuous display. Option saved on the order and used from the Dashboard.
Tip
If you display several curves at the same time:
- Click on a legend below the graph to display / hide this curve.
- Ctrl Click on a legend allows you to display only this one.
- Alt Click on a legend allows you to display them all.
Graphic on views and designs
You can also display the graphs on the views (we will see here the configuration options and not how to do it, for that you have to go to the documentation of the views or designs in function). Here are the options :
Once a data is activated, you can choose :
- Color : The color of the curve.
- Type : The type of graph (area, line or column).
- Ladder : Since you can put several curves (data) on the same graph, it is possible to distinguish the scales (right or left).
- Staircase : Displays the curve as a staircase or a continuous display.
- Stack : Stack the values of the curves (see below for the result).
- Variation : Displays the difference in value from the previous point.
Option on the history page
The history page gives access to some additional options
Calculated history
Allows to display a curve according to a calculation on several commands (you can do almost anything, + - / * absolute value … see PHP documentation for some functions). Ex : abs(\ [Garden ] \ [Hygrometry ] \ [Temperature ] - \ [Living space ] \ [Hygrometry ] \ [Temperature ])
You also have access to a management of calculation formulas which allows you to save them for easier re-display.
Tip
Just click on the name of the object to unfold it, and bring up the historical commands that can be displayed.
Command history
In front of each data that can be displayed, you will find two icons :
- Trash can : Allows you to delete the recorded data; when clicking, Jeedom asks whether to delete the data before a certain date or all the data.
- Arrow : Enables CSV export of historical data.
Inconsistent value removal
Sometimes you may have inconsistent values on the graphs. This is often due to a concern with interpreting the value. It is possible to delete or change the value of the point in question, by clicking on it directly on the graph; in addition, you can adjust the minimum and maximum allowed to avoid future problems.