knxSecure plugin
The knxSecure plugin lets you control and monitor a KNX installation from Jeedom through a KNX/IP gateway. It supports KNX IP Secure (encrypted TCP tunneling and secure routing), reading ETS projects (.knxproj) and keyrings (.knxkeys), as well as a real-time bus monitor.
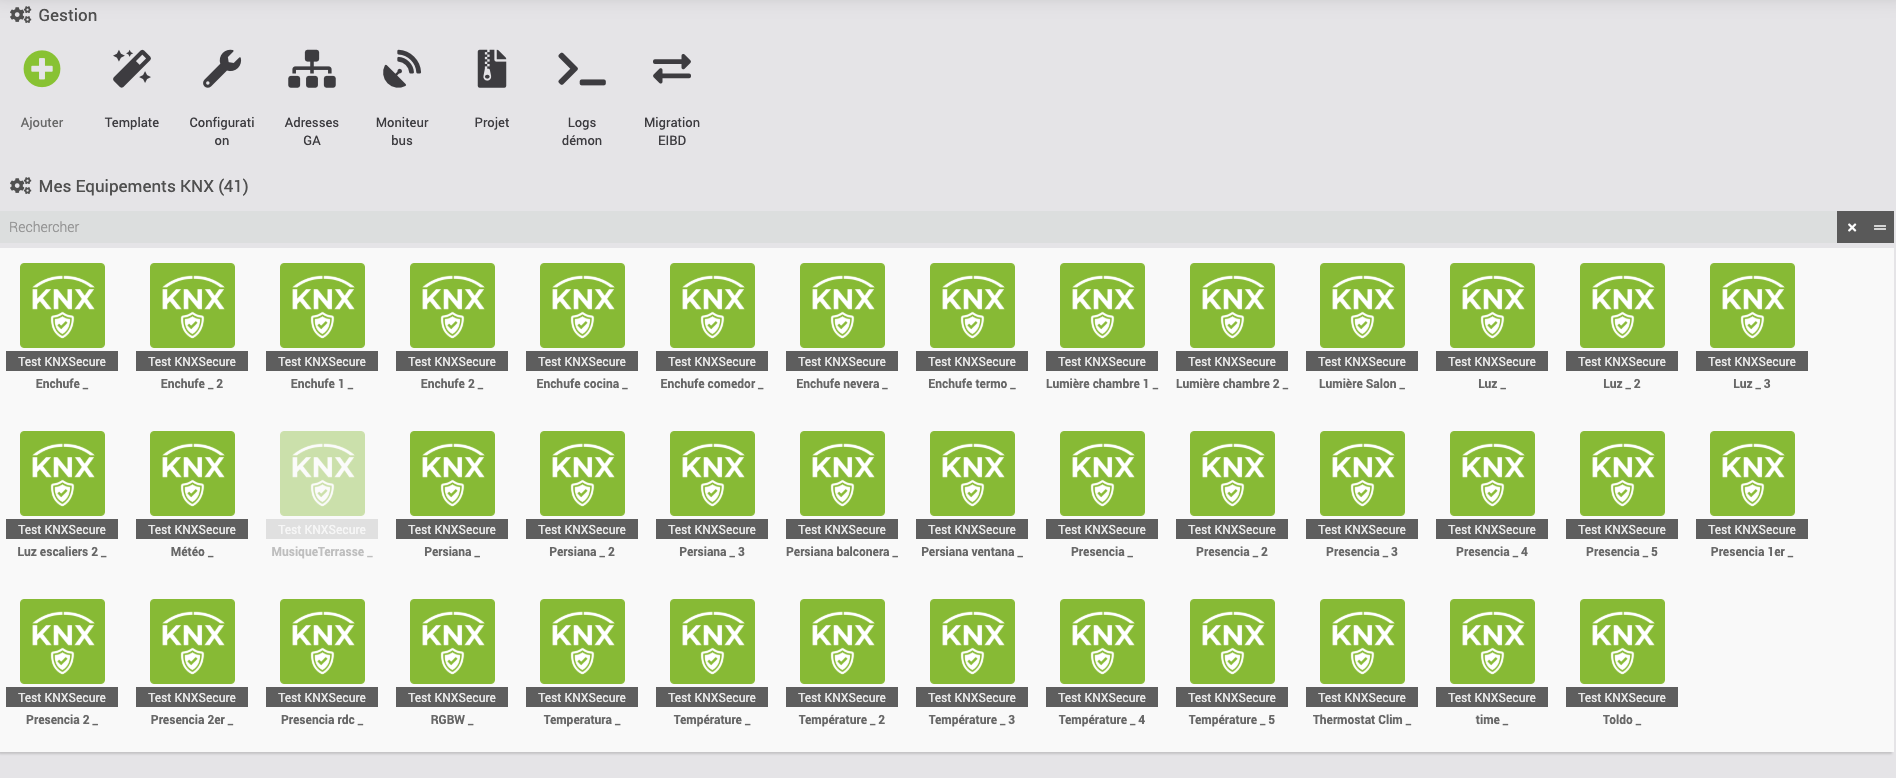
How it works
Jeedom (PHP) ◄──TCP socket──► Python daemon ◄──KNX/IP──► Gateway ◄──► KNX bus
A Python daemon (based on the xknx library) keeps the connection to the KNX/IP gateway alive. Jeedom talks to this daemon; state changes reported by the bus update the commands in real time.
Compatibility
- Jeedom ≥ 4.2, PHP 8.1+
- Any KNX/IP gateway/router (tunneling or routing)
- KNX IP Secure (ETS 5.5+ / ETS 6)
- The daemon requires Python 3 and installs its dependencies automatically (
xknx,xknxproject)
Installation
- Install the plugin from the Jeedom Market.
- Enable it on the plugin page.
- Run the dependency installation (Dependencies button on the configuration page). The plugin creates an isolated Python environment and installs
xknxandxknxproject. - Start the daemon.
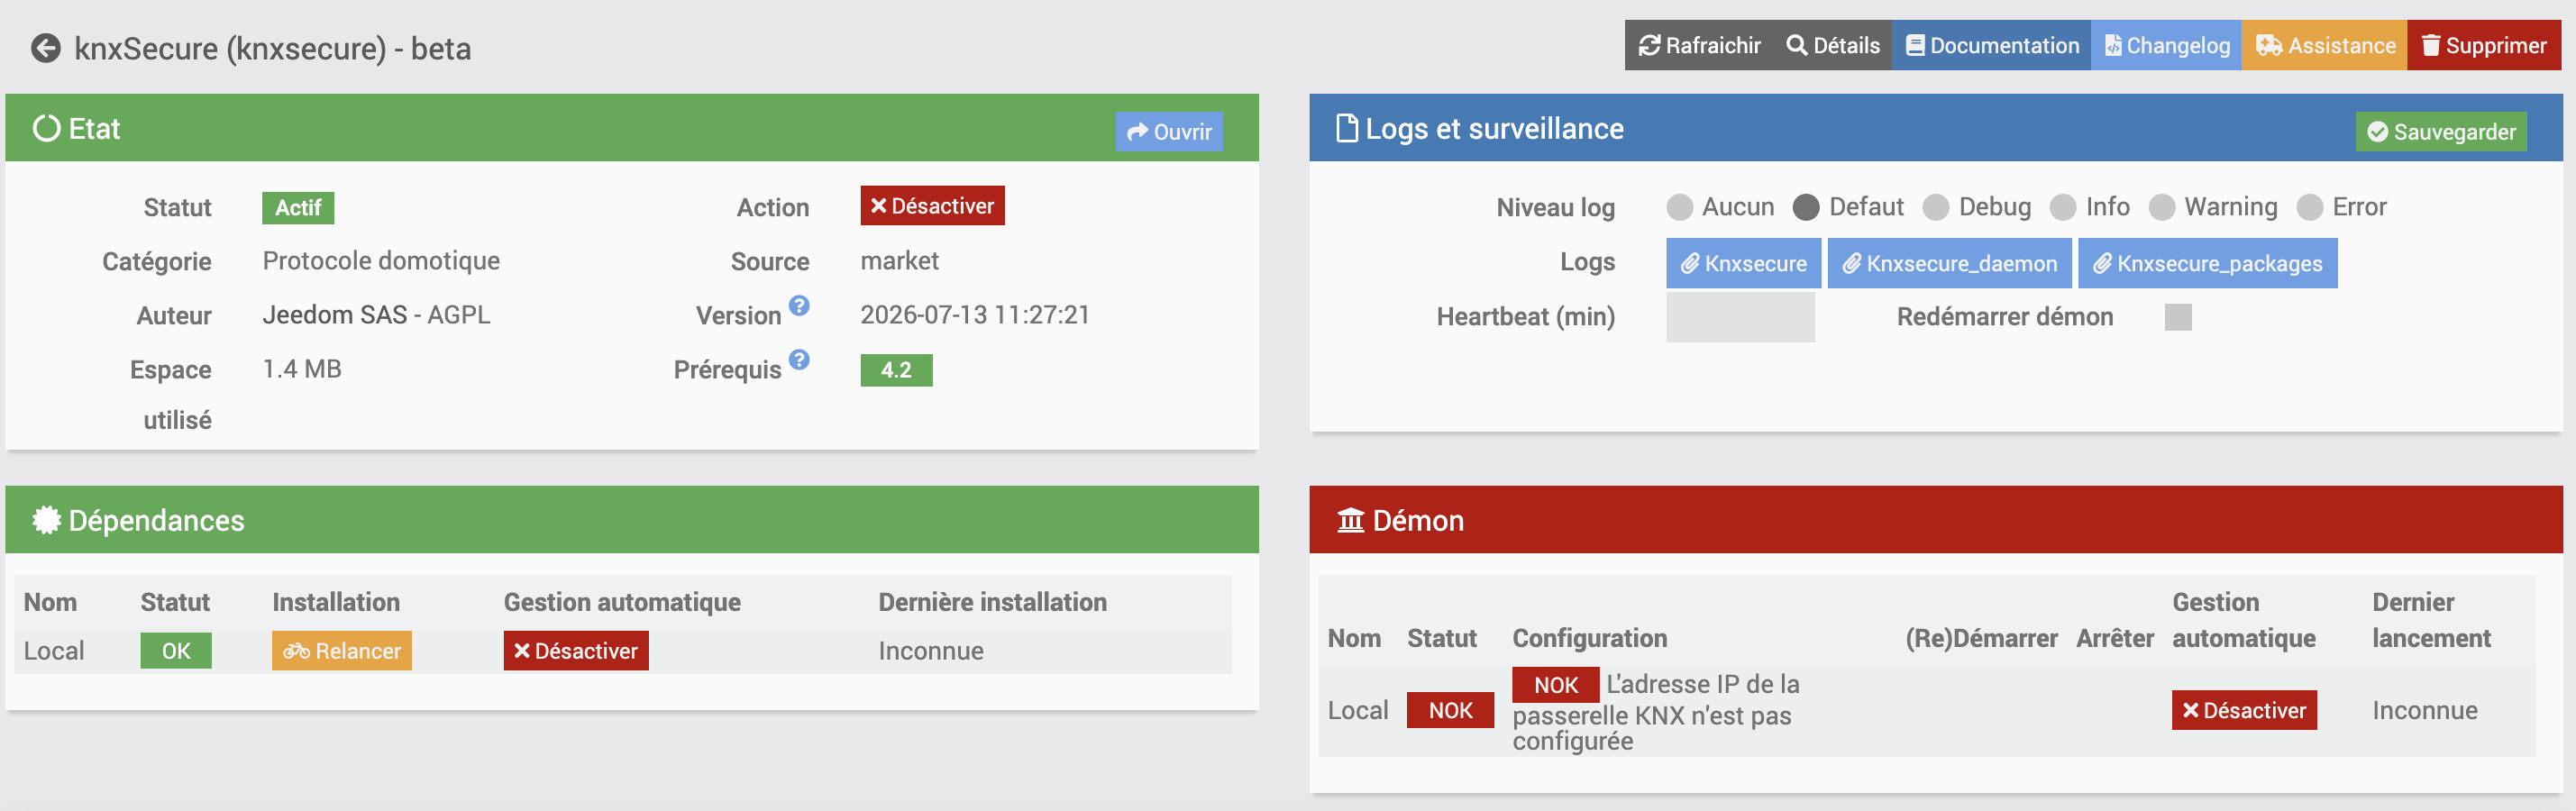
Check the state of the dependencies and the daemon on the plugin’s Health page (see below).
Getting started, step by step
This walkthrough takes you from installation to a first device that reacts. Each step has a checkpoint: only move on once it is green.
-
Install the dependencies. Configuration page → Dependencies button. Wait for the installation to finish. → Check: on the Health page, the Python dependencies indicator is green.
-
Choose the connection mode. KNX Connection tab → select the mode (most common: UDP Tunneling). In tunneling, click Discover to find your gateway’s IP, or type it in (port
3671). → Check: the IP and port are filled in. In Secure mode, complete the Security tab (see below). -
Start the daemon and test the connection. Daemon tab → Test KNX connection button. → Check: a green “KNX gateway connected” badge. If red → see the Error catalog at the end of this page.
-
Import your ETS project (recommended). ETS Project tab → drop the
.knxproj→ Analyze. This retrieves all your group addresses and their DPTs. → Check: the number of extracted group addresses is displayed. -
Create a first device. Either through auto import (Auto import tab of the project), or manually: new device → pick a profile (e.g. Light on/off).
-
Check that it reacts. On an action command of the device, click Test to send a telegram; open the Bus Monitor at the same time to watch the telegram leave and the state come back. → Check: the info command (state) updates in Jeedom.
If the state does not come back at step 6, it is almost always a matter of flags (
FlagInit) or the state GA — see Understanding a device and Reading states below.
Health page
The plugin’s Health page shows a synthetic status across 7 indicators, a good first reflex before digging into the logs:
| Indicator | OK | Error |
|---|---|---|
| KNX daemon | daemon running | daemon stopped |
| Daemon configuration | valid configuration (launchable) | incomplete configuration (connection mode not set properly, etc.) |
| Python dependencies | xknx / xknxproject installed in the virtual environment |
virtual environment missing or Python import failing → re-run the dependency installation |
| KNX gateway | gateway reachable by ping (tunneling modes) — not applicable in Routing | gateway unreachable, or IP address not configured |
| KNX connection (daemon) | the daemon reports an active connection to the bus (last heartbeat < 90 s) | no recent heartbeat, or daemon connected but not to the bus (automatic reconnection in progress) |
| .knxkeys file | file present on disk (if the .knxkeys method is chosen in Secure) |
file missing or not imported |
| Daemon socket port | local TCP port listening | port not reachable (daemon starting up, or port conflict) |
KNX connection (daemon) is different from a simple network ping: it reflects the real application state (tunnel or Secure session negotiation), reported by the daemon on every heartbeat.
Connection configuration
The configuration page is organized into four tabs: KNX Connection, ETS Project, Security, Daemon. First choose the connection mode at the top of the page.
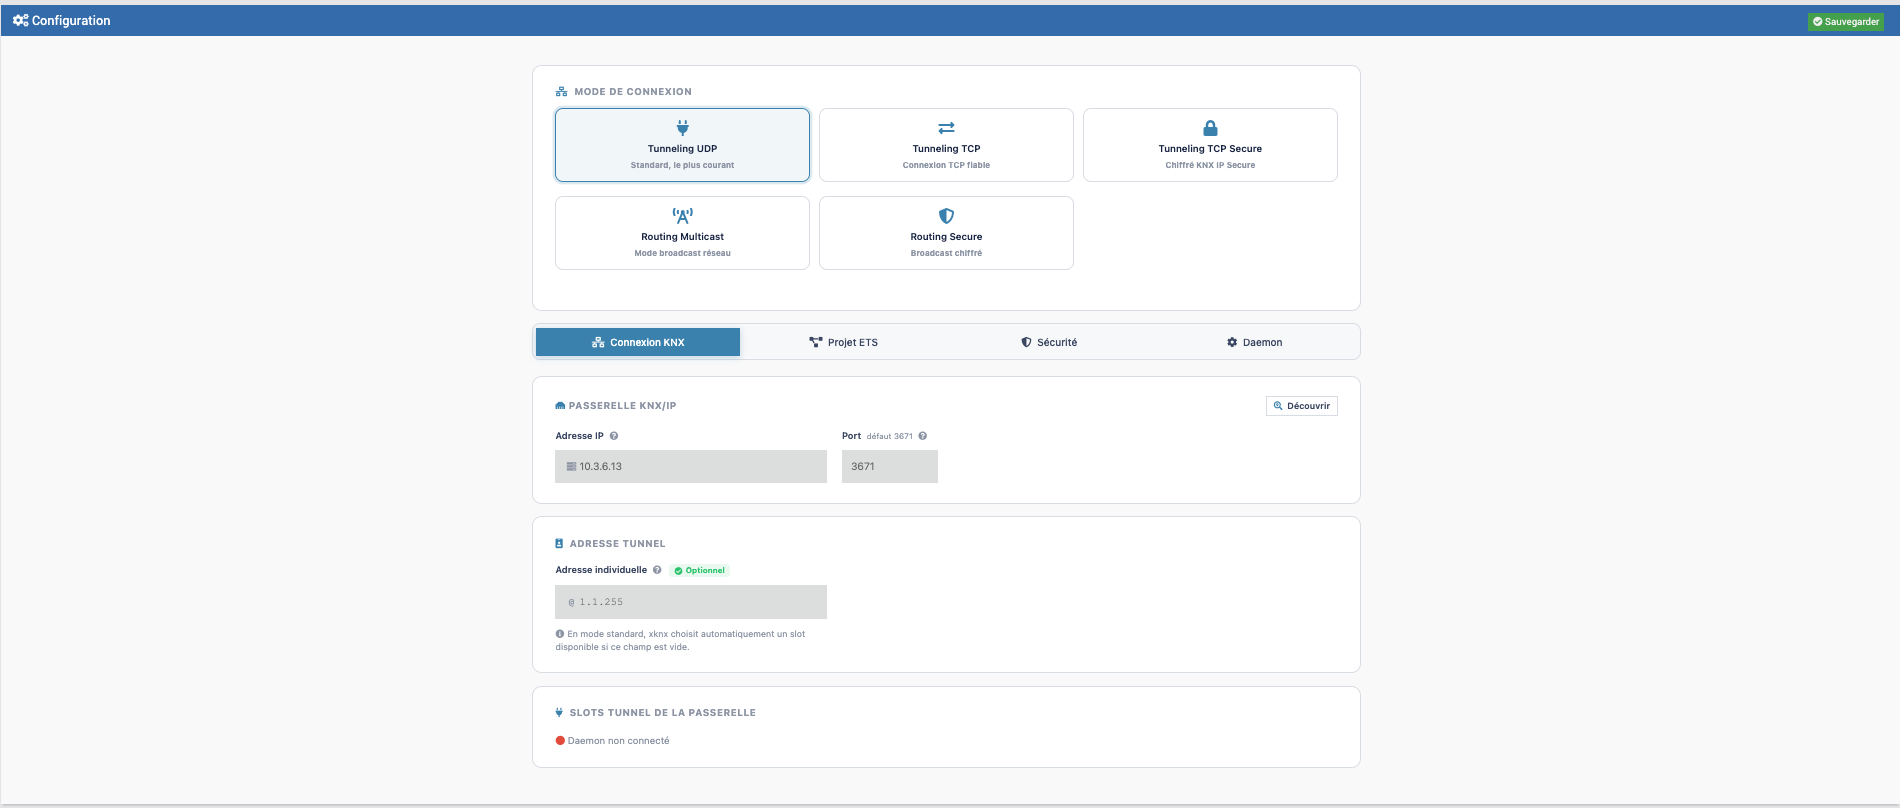
Connection modes
| Mode | Use | Required fields |
|---|---|---|
| UDP Tunneling | The most common. Point-to-point connection through an IP gateway. | IP address, Port (default 3671) |
| TCP Tunneling | Reliable TCP connection (recommended for unstable links). | IP address, Port, optional tunnel address |
| TCP Secure Tunneling | Encrypted KNX IP Secure tunneling. | IP, Port + Security section |
| Multicast Routing | Network broadcast mode (several participants). | Multicast group (default 224.0.23.12), Port, optional local IP |
| Secure Routing | Encrypted broadcast. | Multicast group + Backbone key |
Automatic discovery: in tunneling mode, the Discover button scans the network for available KNX/IP gateways.
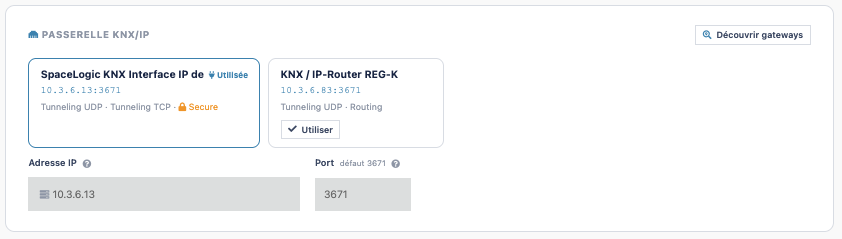
UDP Tunneling
The default and most widespread mode: Jeedom connects point-to-point to the gateway over UDP, just like ETS does. Required fields: the gateway’s IP address and port (default 3671).
The tunnel Individual address field (e.g. 1.1.255) is optional: left empty, xknx automatically negotiates a free tunnel slot with the gateway. Only fill it in if you want to force a specific slot (see Slot status below).
TCP Tunneling
Same as UDP mode (same IP/port fields), but the connection uses TCP instead of UDP. Prefer it if your network link is unstable or goes through a VPN/NAT: TCP guarantees telegram delivery (no silent loss like UDP can have), at the cost of slightly higher latency. The tunnel individual address remains optional, as in UDP.
TCP Secure Tunneling
Encrypted KNX IP Secure tunneling (requires ETS 5.5+ or ETS 6 and a Secure-capable gateway). Same IP/port fields as the two previous modes, mandatorily completed by the Security tab (see below) for authentication.
The tunnel individual address is:
- optional if a
.knxkeysfile is imported — the keyring holds the credentials and xknx picks a compatible slot automatically; - required if you use manual credentials without a
.knxkeys— xknx cannot then negotiate the slot on its own, you must give the exact address of the tunnel slot to use.
Multicast Routing
Broadcast mode: Jeedom joins a network multicast group and sees every telegram on the bus, without reserving a tunnel slot — so several clients (Jeedom, ETS, other supervisors) can be connected at the same time. This is the recommended mode with a KNX IP Router.
Fields: multicast group (default 224.0.23.12), port, and an optional local IP (to fill in if the Jeedom server has several network interfaces, to pick the one that receives the multicast).
Network prerequisites: the router/gateway must have routing enabled with correctly configured filter tables (otherwise commands sent from Jeedom are not relayed onto the physical bus), and the network must allow multicast/IGMP traffic between the Jeedom server and the gateway.
Secure Routing
Encrypted variant of Multicast Routing: same fields and same network prerequisites, plus the Backbone key (32 hexadecimal characters, defined in ETS and shared by all Secure participants of the routing) to fill in the Security tab. An optional latency delay (ms) absorbs clock drift between participants on a network with unreliable timing.
Physical bus interface (TPUART / USB / FT1.2) — not supported
knxSecure handles only KNX/IP gateways (tunneling and routing above). An interface wired directly to the KNX bus (built-in TPUART board, KNX-USB interface, FT1.2 serial coupler) is not supported: the xknx library used by the plugin only speaks KNXnet/IP.
For that kind of installation, use the eibd plugin, designed to drive physical interfaces. You can also install an external knxd service that exposes your physical interface as a local KNX/IP gateway, then point knxSecure at it in Tunneling (127.0.0.1:3671).
Gateway tunnel slot status
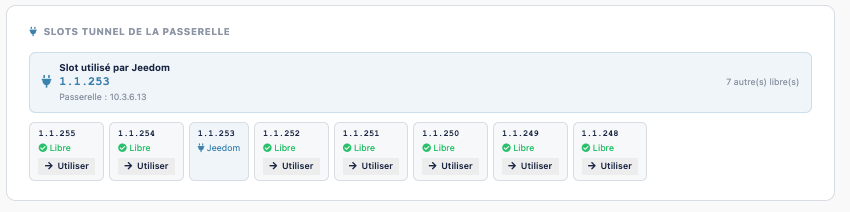
In tunneling modes (UDP/TCP/TCP Secure), a Gateway tunnel slots block shows live:
- the slot used by Jeedom (active individual address) and the number of remaining free slots;
- the list of all slots with their state: Jeedom (used by this plugin), Free, Busy (used by another client), N/A (not supported by the gateway);
- a Use button on a free slot to fill it in automatically as the tunnel address, and Release on a busy slot to force its release.
If the gateway does not answer (daemon not connected or network error), an error message is shown with a Reconnect button.
Security (KNX IP Secure)
This tab is only useful for the TCP Secure Tunneling or Secure Routing modes. Two authentication methods:
Method 1 — .knxkeys file (recommended)
Export the keyring from ETS (Reports → KNX Security → Export keyring), then:
- Drop the
.knxkeysfile into the provided area. - Enter its password (set during the ETS export).
- Click Inspect to check the tunnel slots and keys it contains.
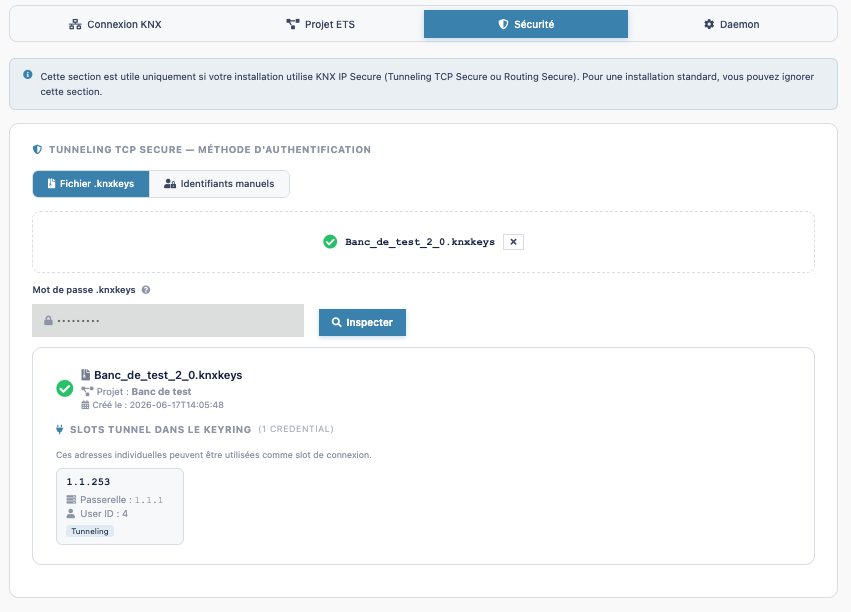
xknx will automatically pick a compatible tunnel slot.
Method 2 — Manual credentials
If you do not have the .knxkeys, enter directly:
- User ID (1–127, default
2) - User password
- Device authentication password
Secure Routing
Enter the Backbone key (32 hexadecimal characters) and, if needed, the latency in milliseconds.
Importing an ETS project (.knxproj)
Importing an ETS project automatically retrieves the list of group addresses, their DPT and the topology, without typing them by hand.
- ETS Project tab → drop your
.knxprojfile. - If the project is protected, enter the ETS password.
- Click Analyze the project.
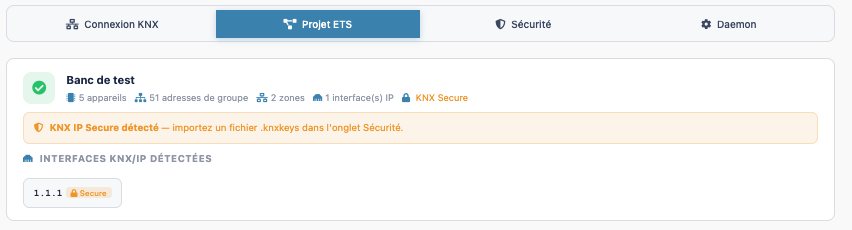
The plugin extracts the group addresses (with their original DPT), the topology (areas, lines, participants) and the locations. This data then feeds device creation and the bus monitor.
Analysis is done through the daemon if available, otherwise through a built-in native PHP parser (reading the
.knxprojZIP with no dependency).
Re-importing a project (change detection)
Re-importing a .knxproj on top of an already loaded project automatically triggers a comparison with the previous import, shown as counters per change type: added, removed, DPT changed, renamed, with the address-by-address detail for each category.
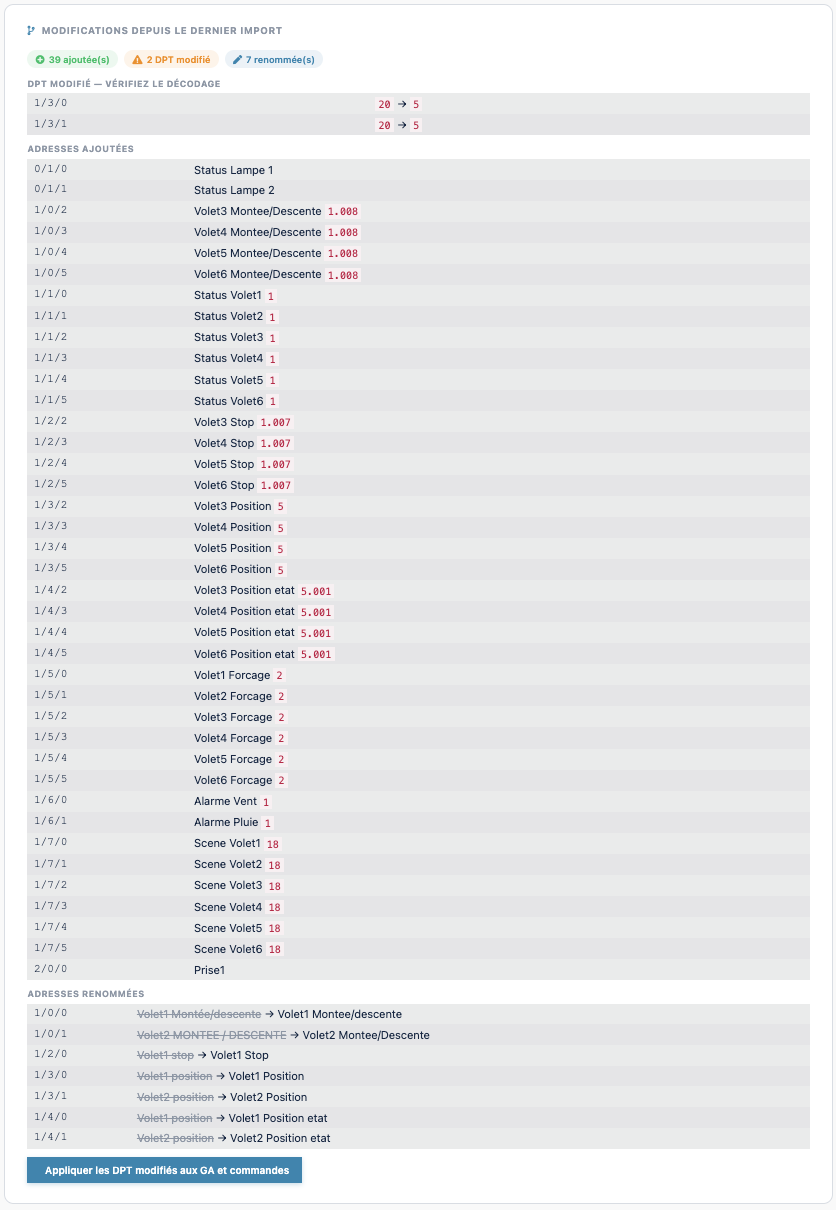
If some DPTs have changed, an Apply the changed DPTs to GAs and commands button updates in one click the DPT stored on the affected group addresses as well as on the commands of the devices that use them — this avoids fixing every command by hand after an ETS project evolves.
The Replace / Clear buttons (on the loaded project summary) respectively re-run an import or delete the stored project.
Automatic device import
Once an ETS project is analyzed, the plugin can create the devices on its own, without manual entry. Auto import tab of the Project modal → Mode selector, then Analyze to preview, tick what suits you, and Create the selected devices.
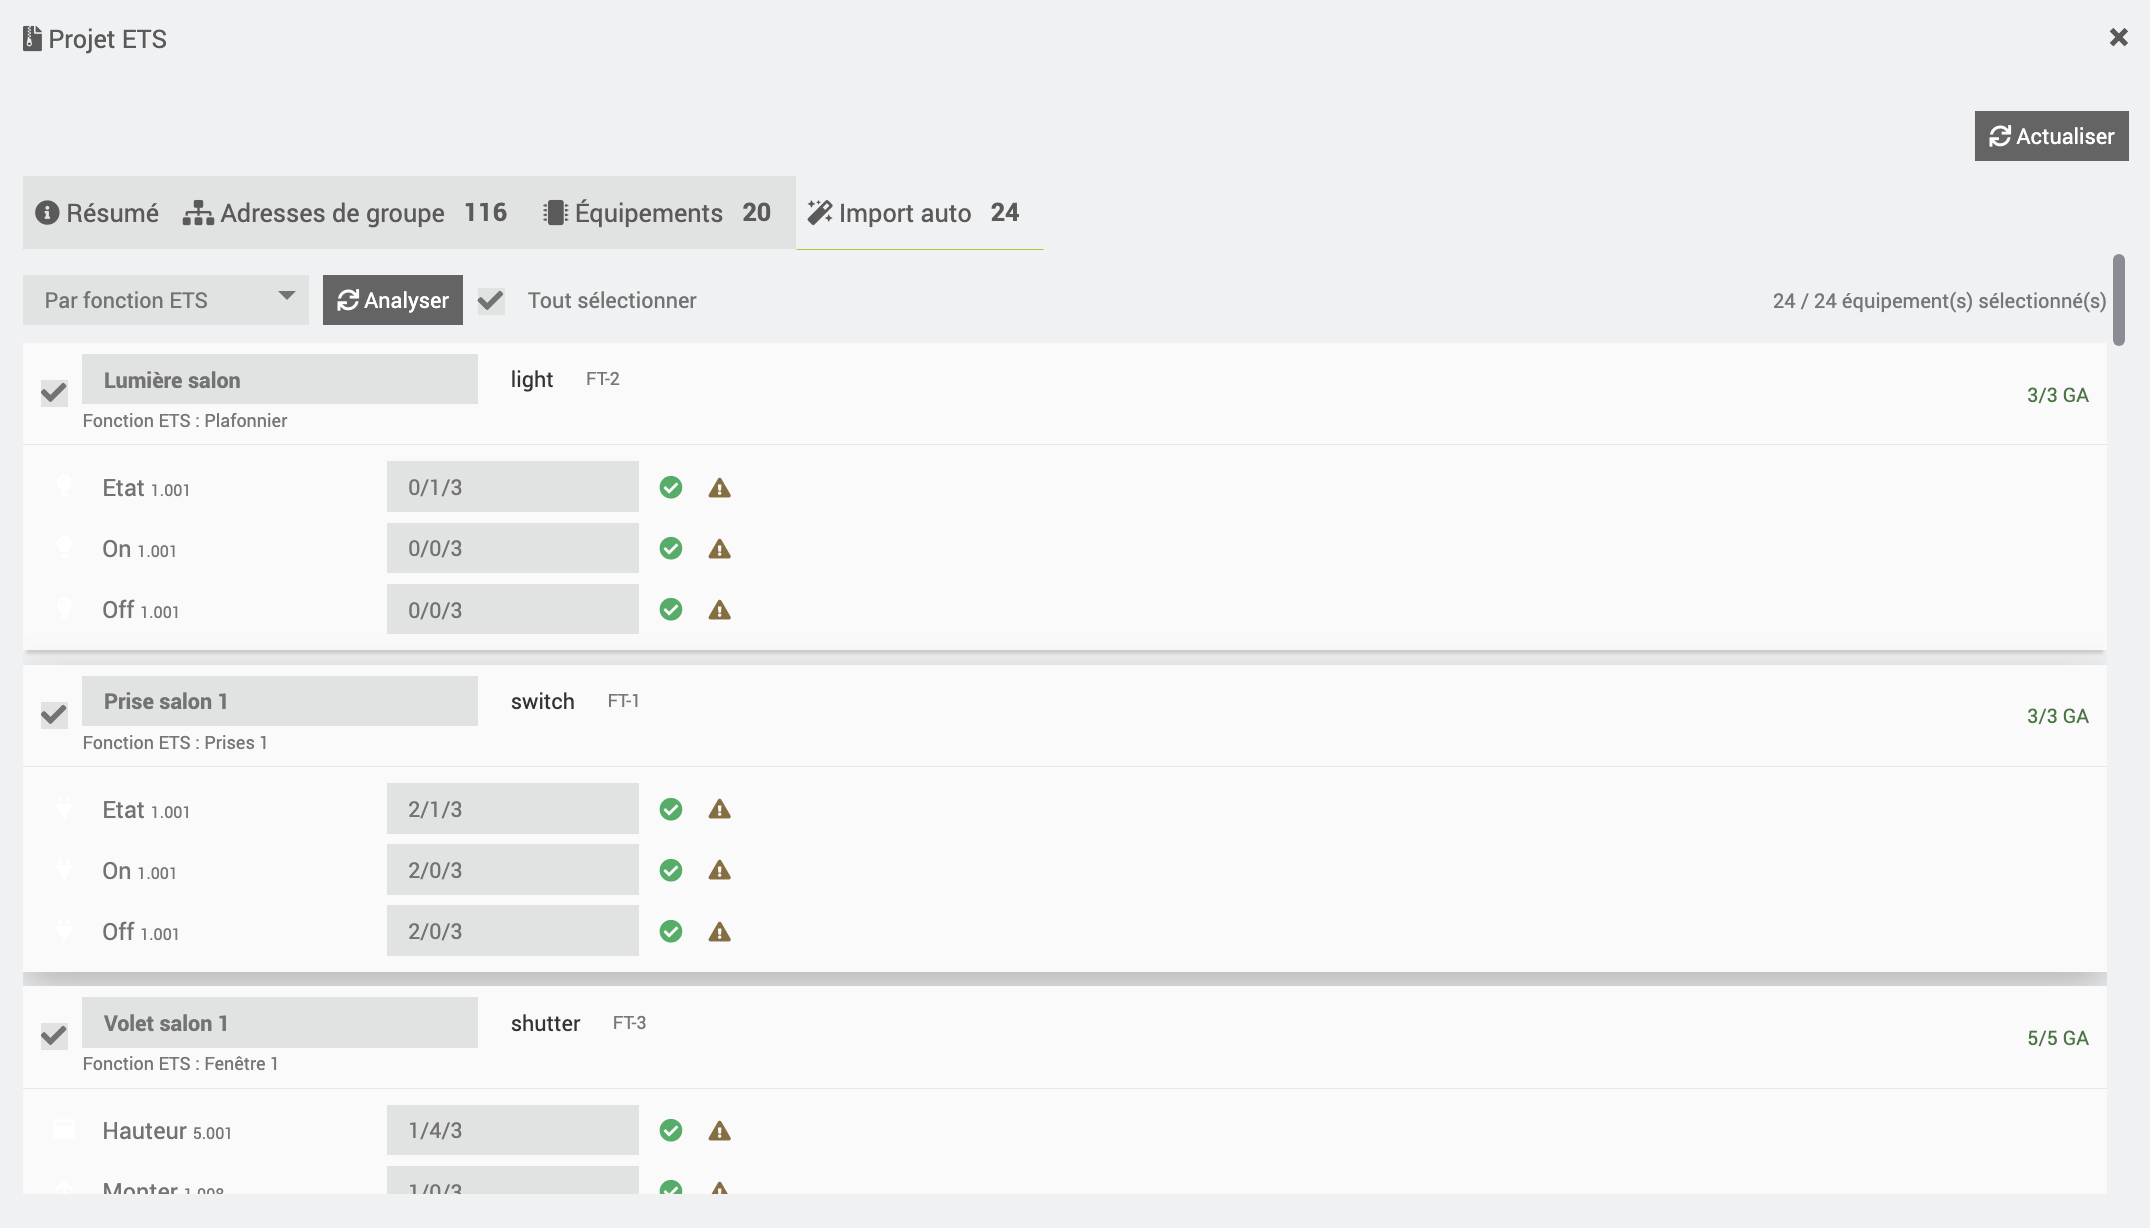
Three grouping modes:
| Mode | Groups the GAs… | When to use it |
|---|---|---|
| By ETS function | according to the Functions defined in ETS | if your ETS project contains functions (most reliable) |
| By address folder | by root folder + name identity (“Light 1” and “Light 1 status” → same device) | if the project has no ETS functions |
| By device | by physical KNX device (Topology tab) | to recover a device per physical module |
If you choose By function but the project contains no ETS function, the plugin automatically falls back to By folder mode. The device type (light, shutter…) and the DPTs are guessed from ETS; check the result before validating.
Migrating from the eibd plugin
If you were already using the eibd plugin, knxSecure can recreate your devices while keeping group addresses and commands — no need to re-enter everything.
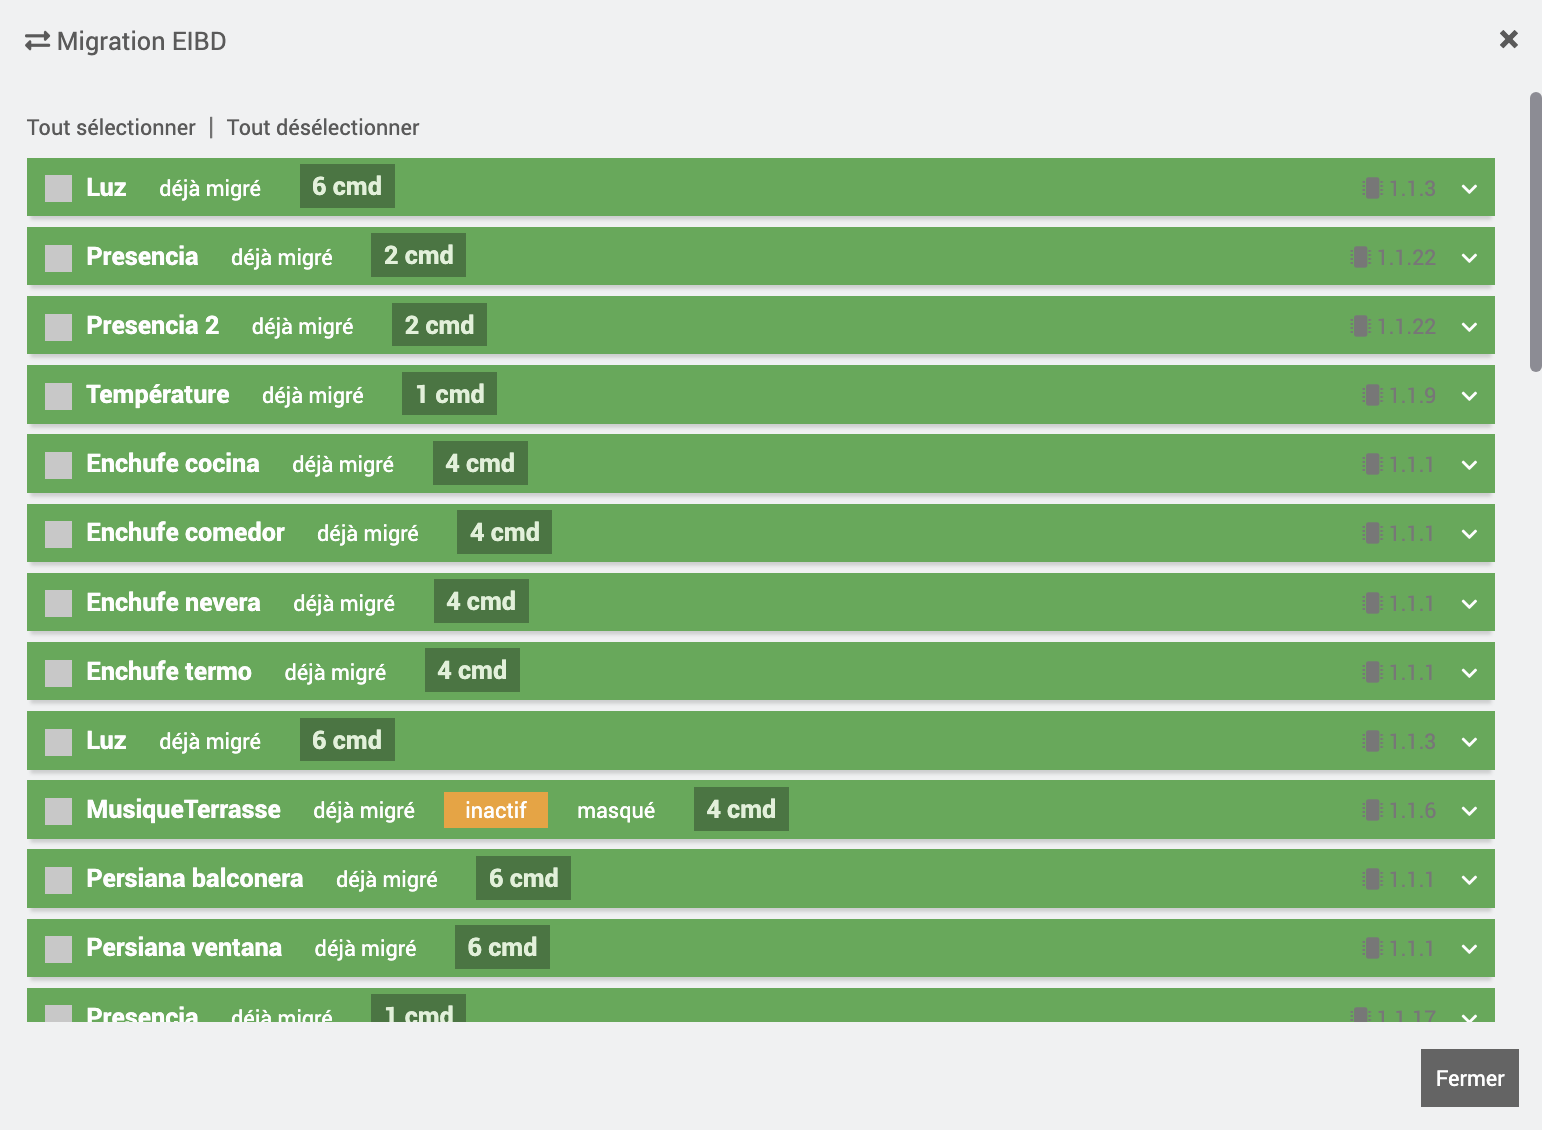
- EIBD Migration button (plugin page) → the list of your eibd devices is shown with checkboxes.
- Tick the devices to migrate (or all of them), then Migrate the selection.
- A window offers a destination object (Jeedom room): leave it empty to keep each device’s original object.
What is carried over automatically: the name, the object/room, the group addresses (normalized to 3 levels if needed), the DPTs (proprietary ABB DPTs are ignored), the action/state mapping, and the widget of the detected type. A device already migrated is not recreated twice.
Migration does not delete your eibd devices: both coexist as long as you do not disable the old one. Test the behavior under knxSecure before removing eibd.
Creating devices
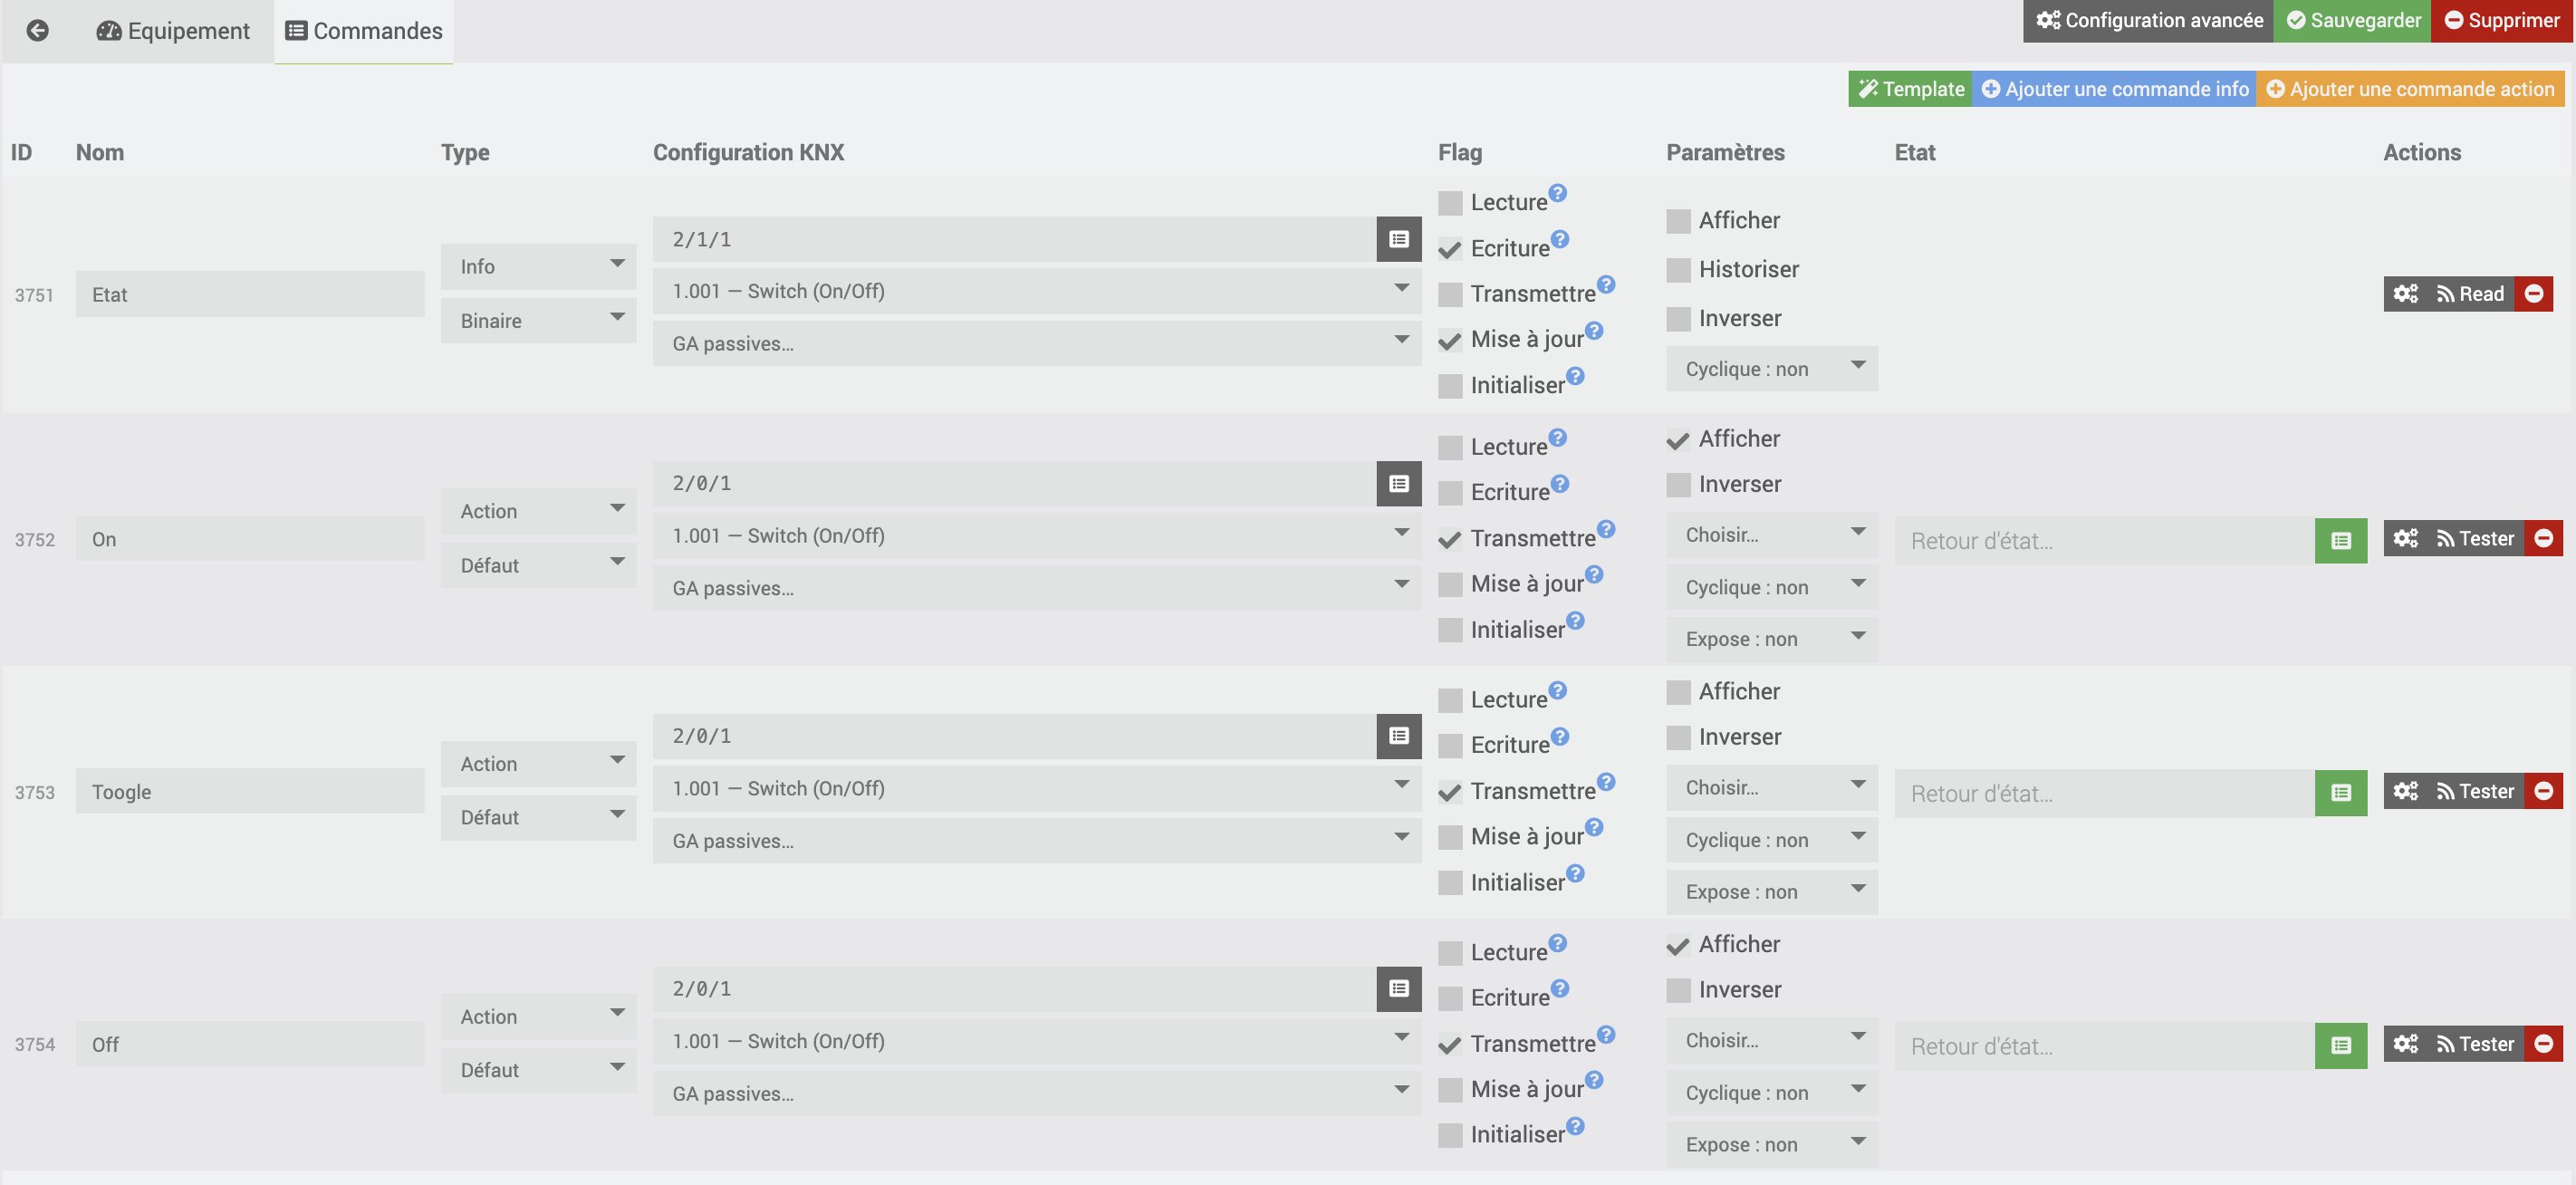
Each knxSecure device represents a KNX appliance (light, shutter, thermostat…). Its commands carry the group addresses:
infocommand: state address (ga_state) — Jeedom reads the value reported by the bus;actioncommand: write address (ga_write) — Jeedom sends a telegram onto the bus.
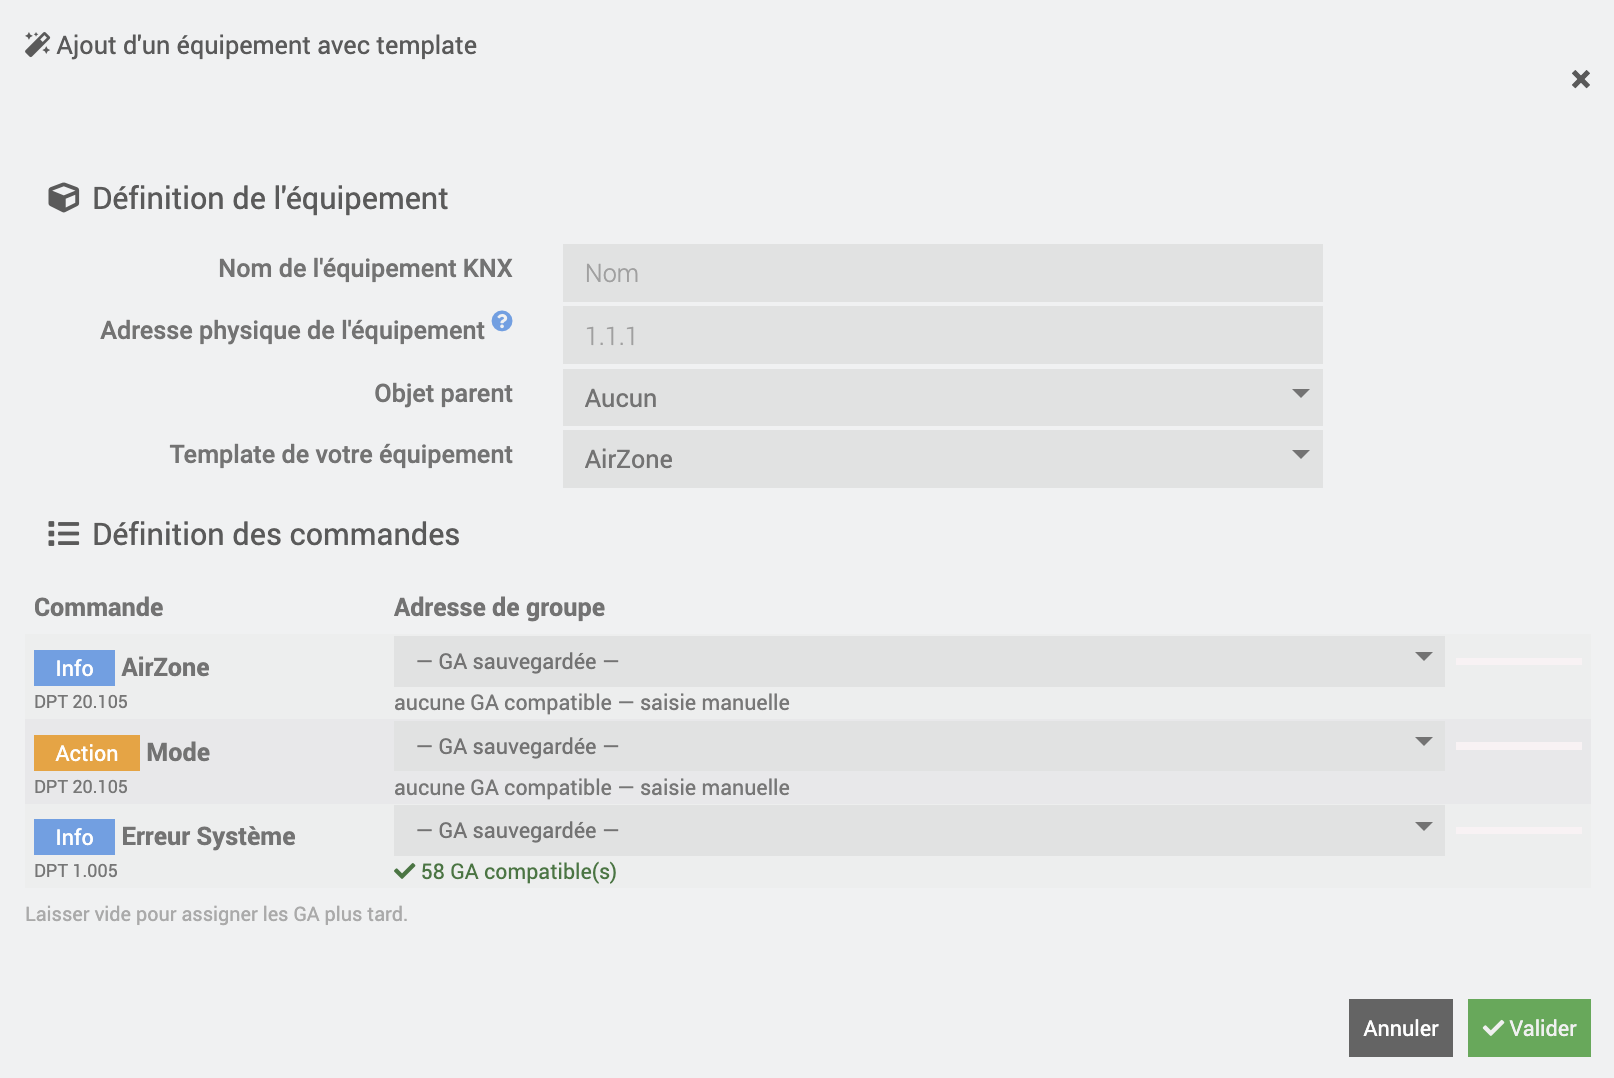
Ready-to-use profiles
At creation time, a profile automatically applies the right commands and the right widget. Available profiles:
| Category | Profiles |
|---|---|
| Lighting | Light on/off, dimmer, push button |
| Openings | Shutter/blind, lock/gate, door/window contact |
| Heating / Climate | Thermostat, underfloor heating |
| Sensors | Temperature, presence/motion, generic numeric sensor |
| Comfort | Fan/HRV, scene, mode selector |
| Security | Alarm, detector |
| Energy | Meter (power, consumption, V/A) |
| Miscellaneous | Weather station, text notification, numeric value, generic switch |
You can also start from a generic profile and add the commands manually.
Automatic DPT
When commands are created from addresses imported from the .knxproj, the DPT is propagated automatically and the Jeedom subtype (binary / numeric / string) is derived from the main DPT.
KNX flags
Each command carries five checkboxes (the Flags column) that determine its behavior on the bus. These are the standard KNX flags:
| Flag | Role | Typically active on |
|---|---|---|
Read (Read) |
Jeedom answers a Read telegram received on this GA by sending the current value. Only one object per GA should have it. | rare |
Write (Write) |
The command value is updated when a participant writes on this GA. | info (state) commands |
Transmit (Transmit) |
When the value changes in Jeedom, a Write telegram is sent onto the bus. | action commands |
Update (Update) |
The value also updates from read responses (not only from writes). | info commands |
Initialize (FlagInit) |
At daemon startup, a Read is sent on this GA to fetch the current state. | info commands whose state you want at boot |
Simple rule: an info command usually has Write + Update + Initialize; an action command has Transmit. Ready-to-use profiles already set these flags correctly — you only touch them for special behavior.
Using a command in a scenario
- An action command is called like any Jeedom action (scenario, interaction, dashboard button). Depending on its subtype: slider (numeric value, e.g. brightness 0-100 %), select (mode, e.g. Comfort/Eco), color, or button (sends its default value,
1if not set). - An info command (state) is read in a scenario condition or shown as a widget — it does not “execute”.
- To test an action without a scenario: Test button on the command (sends a GroupWrite), or manual sending from the Bus Monitor.
DPT reference
The DPT (Datapoint Type) describes how to interpret the bytes of a KNX telegram. It is the setting to watch when a value shows incorrectly: the DPT of the Jeedom command must match the one defined in ETS for that group address. When importing a .knxproj, it is carried over automatically.
Main DPTs and their interpretation in Jeedom:
| DPT | Meaning | Unit | Jeedom subtype |
|---|---|---|---|
| 1.001 | On/Off | — | binary |
| 1.008 | Up/Down (shutter) | — | binary |
| 1.009 | Open/Close | — | binary |
| 3.007 / 3.008 | Relative dimming / blind (+ stop) | — | action |
| 5.001 | Percentage 0-100 % (brightness, shutter position) | % | numeric |
| 5.003 | Angle 0-360° | ° | numeric |
| 6.001 | Signed percentage -128..127 | % | numeric |
| 7.001 | 16-bit integer (0-65535) | — | numeric |
| 7.013 | Illuminance | lx | numeric |
| 9.001 | Temperature | °C | numeric |
| 9.004 | Brightness | lx | numeric |
| 9.007 | Humidity | % | numeric |
| 9.008 | Air quality | ppm | numeric |
| 9.024 | Power | kW | numeric |
| 12.xxx | Unsigned 32-bit integer | — | numeric |
| 13.010 / 13.013 | Active energy | Wh / kWh | numeric |
| 14.056 | Physical quantity (32-bit float) | per label | numeric |
| 16.000 / 16.001 | Character string (14 chars) | — | string |
| 17.001 / 18.001 | Scene number / control | — | numeric |
| 20.102 | HVAC mode (Comfort, Eco…) | — | select |
| 232.600 / 251.600 | RGB / RGBW color | — | color |
Non-exhaustive list: the plugin’s DPT selector covers DPTs 1 to 251. For an unlisted DPT, pick the family (main number) matching the data size.
Diagnosing a DPT with the Bus Monitor
Unsure about the right DPT? Open the Bus Monitor and act on the device from another client (ETS, wall button):
- Spot the group address in the stream.
- Compare the decoded value to the real value:
21.5where it is 21.5 °C → correct DPT; an off value (e.g.5504) → probably wrong DPT (here a 9.001 read as an integer). - Adjust the command’s DPT accordingly, then re-test.
Concrete examples
Three typical cases. The commands and flags shown are those applied automatically by the profiles — useful to understand or fix a device created by hand.
Dimmer light
| Command | Type | DPT | GA (example) |
|---|---|---|---|
| On/Off | action | 1.001 | 1/1/1 |
| On/Off state | info | 1.001 | 1/4/1 |
| Brightness (0-100 %) | action | 5.001 | 1/2/1 |
| Brightness state | info | 5.001 | 1/5/1 |
Shutter / blind
| Command | Type | DPT | Note |
|---|---|---|---|
| Up/Down | action | 1.008 | 0 = up, 1 = down |
| Stop / step | action | 1.007 or 3.008 | stops the movement |
| Position (0-100 %) | action | 5.001 | 0 % = open, 100 % = closed (manufacturer-dependent) |
| Position state | info | 5.001 | reports the real position |
The 0 % / 100 % convention (open/closed) depends on the shutter manufacturer. If the display looks inverted, that is what to check, not the DPT.
Thermostat
| Command | Type | DPT | Role |
|---|---|---|---|
| Setpoint | action | 9.001 | target temperature (°C) |
| Setpoint state | info | 9.001 | current setpoint |
| Measured temperature | info | 9.001 | ambient temperature |
| Mode | action | 20.102 | Comfort / Standby / Eco / Frost protection (select) |
| Mode state | info | 20.102 | current mode |
Group addresses (GA)
The group address manager (Group addresses modal) centralizes all known GAs — imported from ETS or added manually — organized into hierarchical groups (main / middle).
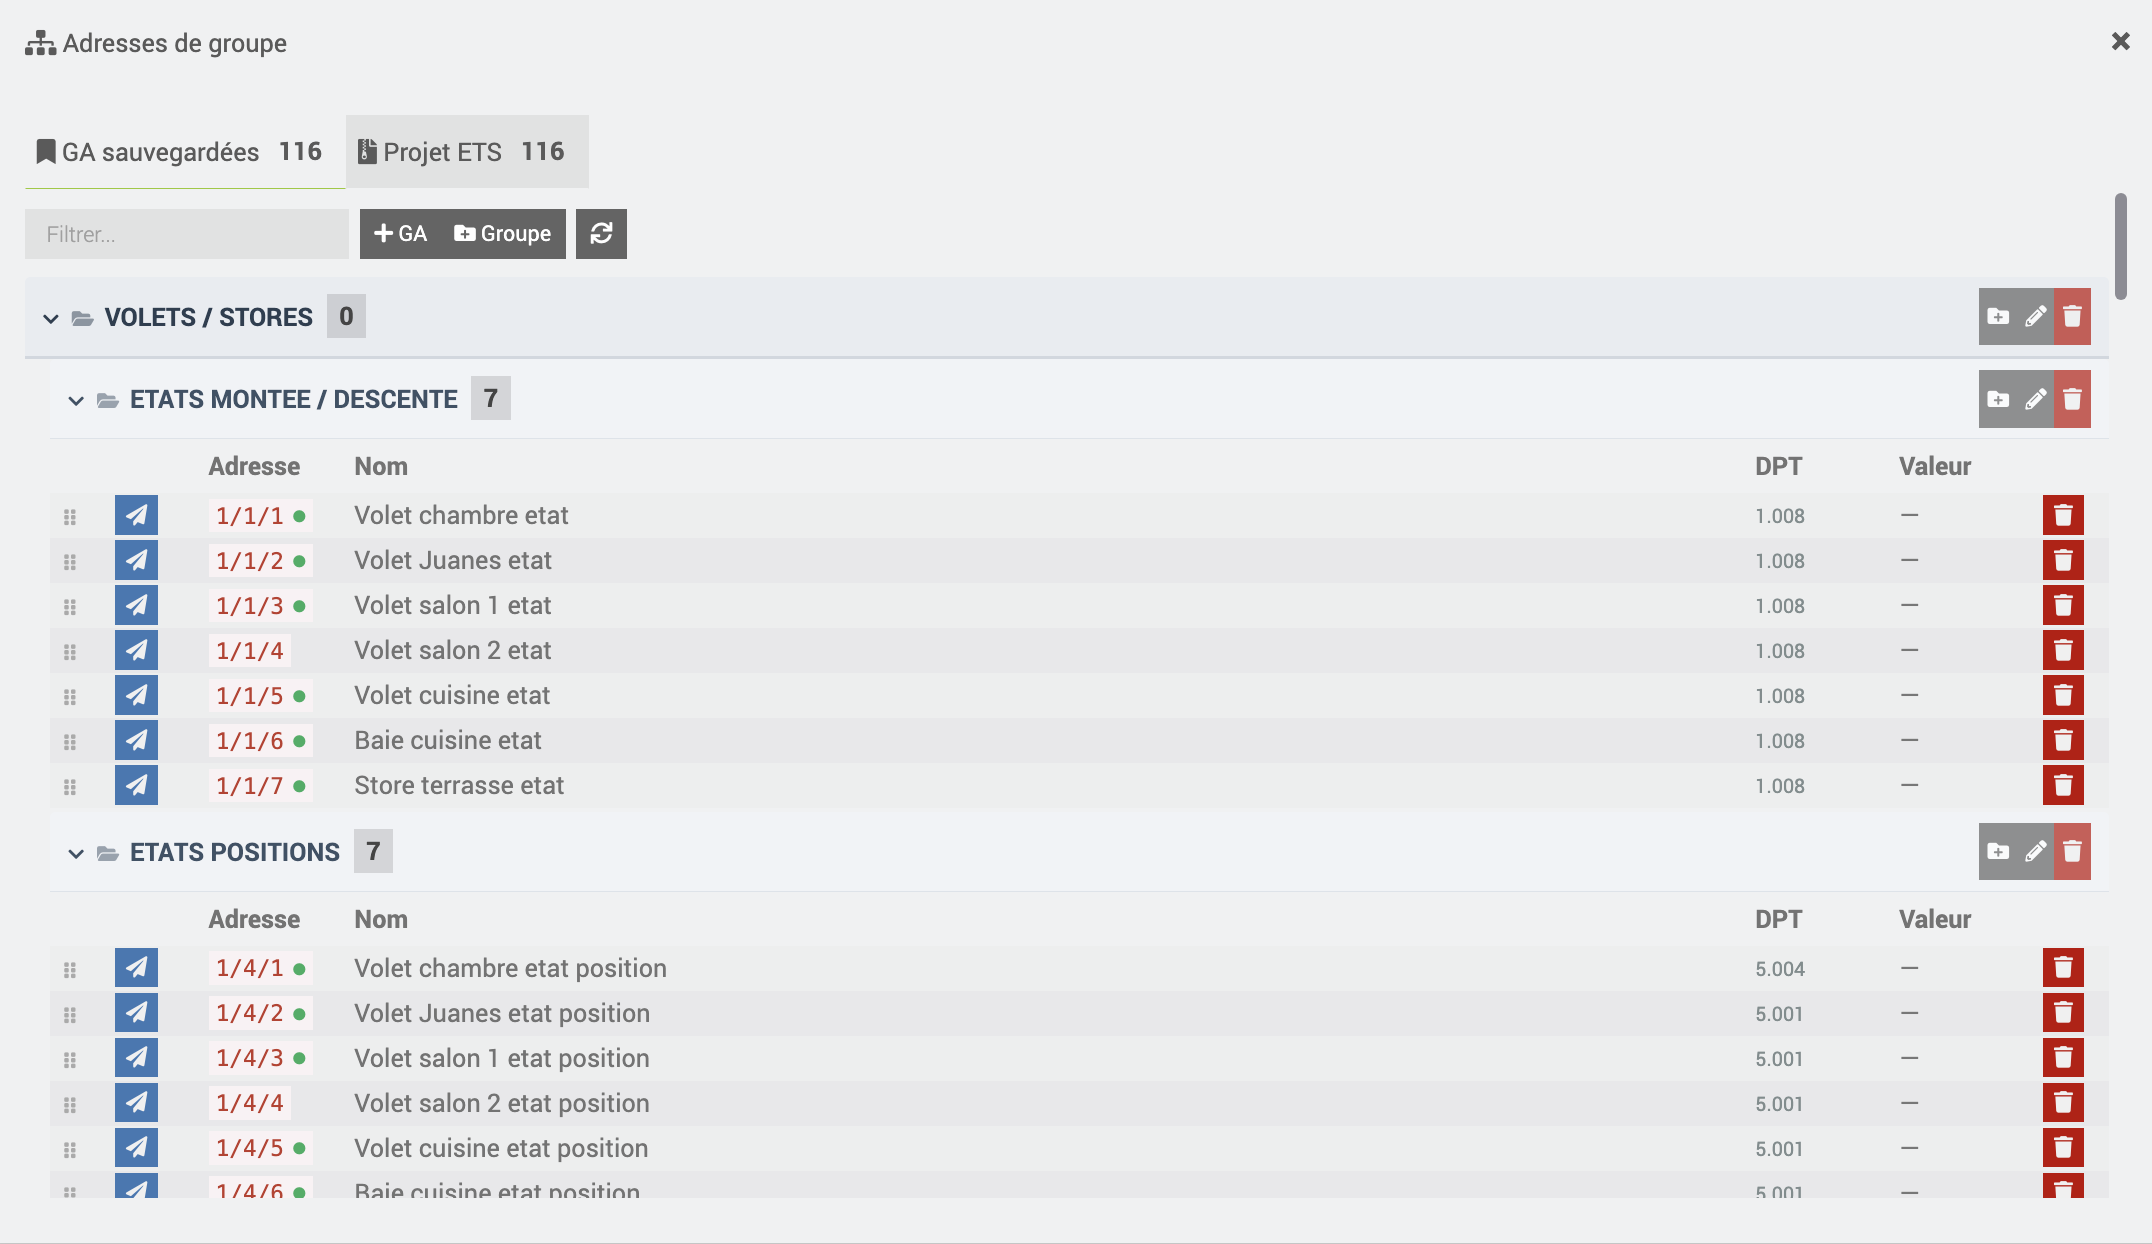
- View the GAs and their last known value on the bus.
- Organize the GAs into groups (reuses the ETS hierarchy if it exists).
- A discreet green dot marks a GA already assigned to a device.
Bus Monitor
The monitor shows in real time the telegrams flowing on the KNX bus (automatic refresh every 2 seconds):
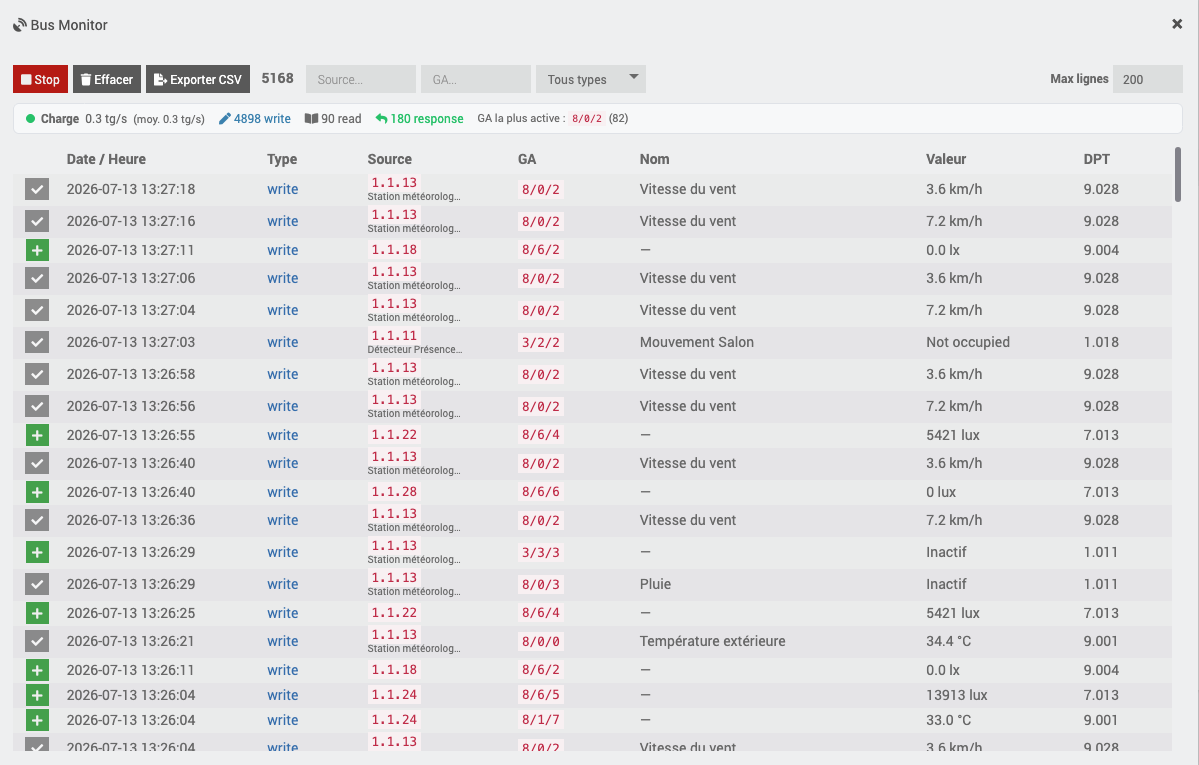
- type (write / read / response), group address, source address, value decoded per DPT with its unit (°C, lux, %…) when a Jeedom command exists for that GA;
- filters by source, by group address and by telegram type;
- load statistics: bus throughput (instantaneous and average telegrams/s), breakdown by type, most active GA, with a load indicator (green / orange / red) — useful to spot a saturated bus or a “chatty” device;
- CSV export of the history (Excel-compatible — the GA column is protected from the automatic date reformatting Excel/LibreOffice does on an address like
8/6/2); - manual sending of a test telegram (GroupWrite / GroupRead) on a given GA, also available through the Test button of each action command on the device page.
It is the main diagnostic tool to check that a device reacts, identify the real address used, or diagnose a bus overload.
If a GA has no DPT in the loaded ETS project (e.g. a device migrated from EIBD with an older ETS project), the DPT of the matching Jeedom command is used as a fallback for correct decoding.
Reading states (FlagInit / Cyclic)
So that Jeedom knows the real bus state:
- FlagInit: at daemon startup, a
GroupValueReadis emitted automatically on every command whoseFlagInitflag is active, to fetch the current state. - Startup state cache: the daemon remembers the last known values. On restart, it displays them immediately in Jeedom without waiting for the bus. The Startup state cache parameter (Daemon tab), if > 0, avoids re-querying addresses whose state is more recent than the given duration — useful to avoid a burst of reads on a large installation.
- Cyclic reading: a command can be re-read periodically (interval ≥ 10 s) — useful for devices that do not report spontaneously.
- Automatic reconnection: if the gateway drops, the daemon retries the connection with an increasing delay (up to 60 s), with no intervention.
Daemon tab
The Daemon tab gathers the internal settings of the Python process and a connection diagnostic tool. It is split into two blocks: Internal parameters and Diagnostic.
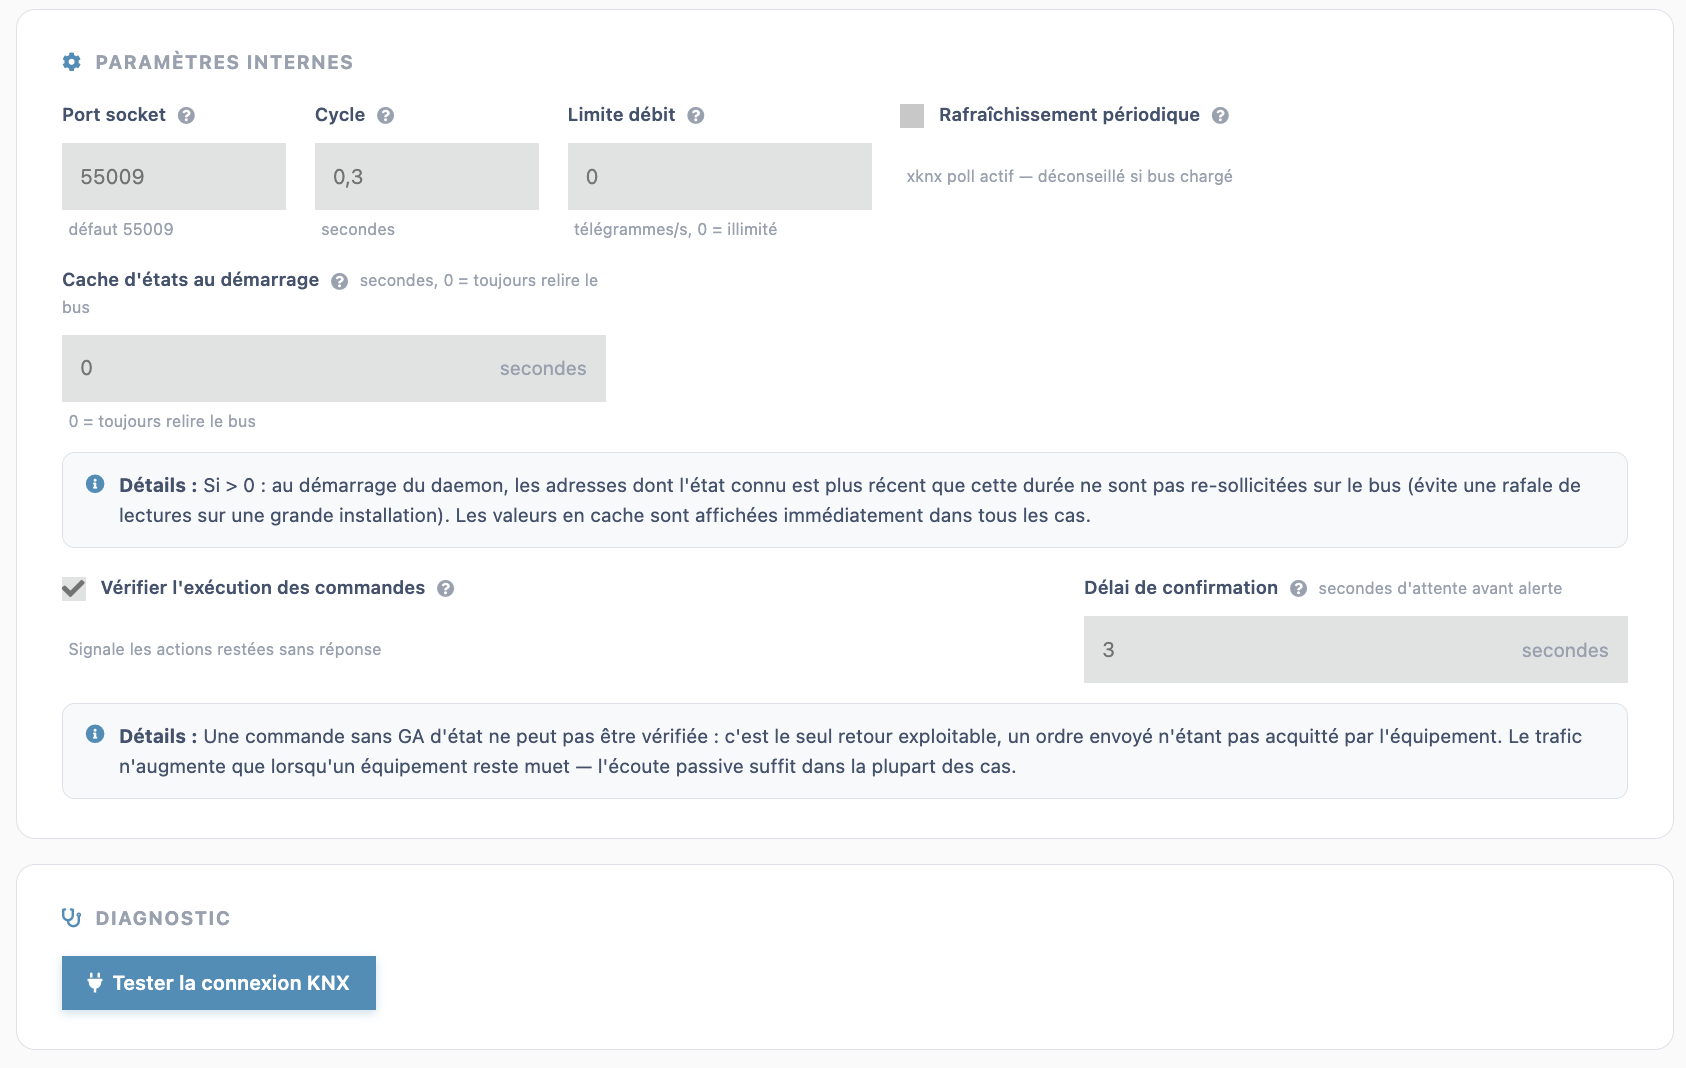
Internal parameters
- Socket port (default
55009) — the local TCP port used by Jeedom to talk to the daemon (independent of the gateway’s3671KNX port). Change it only in case of a port conflict on the Jeedom server. - Cycle (seconds, default
0.3) — the period of the daemon’s internal loop (how often it processes pending events: received telegrams, commands to send). A lower value reduces latency but slightly increases CPU load. - Rate limit (telegrams/s,
0= unlimited) — caps the number of telegrams the daemon can send onto the bus per second. Useful to avoid saturating an old KNX installation or one with many participants during grouped actions (a scenario driving many devices at once, for example). - Periodic state refresh (checkbox, disabled by default) — enables xknx automatic polling, which periodically re-reads the state of all commands. Not recommended if the bus is busy or has many devices: prefer FlagInit and per-command cyclic reading (see Reading states above), which are more targeted.
- Startup state cache (seconds,
0= always re-read the bus) — if greater than0: at daemon startup, addresses whose known state is more recent than this duration are not re-queried on the bus, avoiding a burst of reads (GroupValueRead) on a large installation. In all cases, cached values are displayed immediately in Jeedom, without waiting for the bus.
Diagnostic
The Test KNX connection button queries the daemon live and shows a result badge next to it (visible on the screenshot above):
- green badge — e.g. “KNX gateway connected (10.3.6.13)”: the daemon is properly connected to the bus through this gateway;
- red badge — the gateway is unreachable or the connection failed, with the error message returned by the daemon.
It is the fastest way to validate a configuration (connection mode, IP, Secure credentials…) without waiting or restarting the daemon.
Troubleshooting
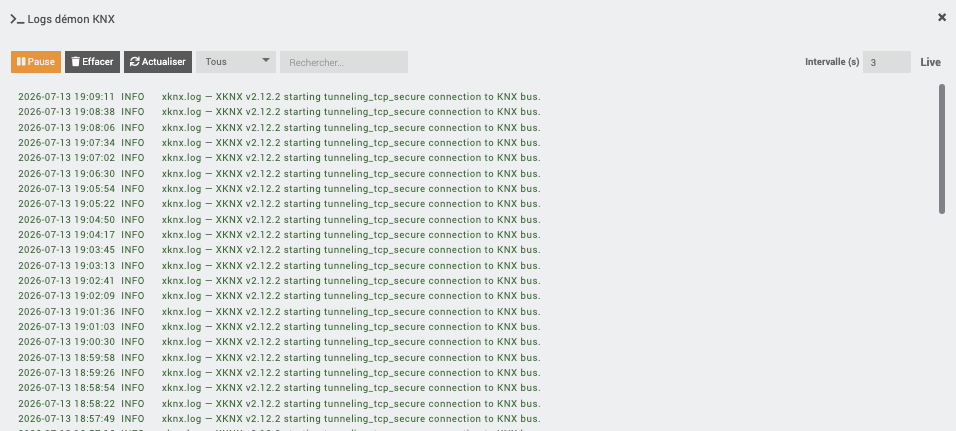
First reflex: the Health page (synthetic status), then the Test KNX connection button (Daemon tab), and finally the daemon logs (built-in viewer) for the detailed message.
Error catalog (message → cause → solution)
The messages below are those shown by the plugin (test window, Health page, logs).
Connecting to the gateway
| Message | Cause | Solution |
|---|---|---|
| The KNX gateway IP address is not configured | Tunneling mode with no IP set | KNX Connection tab → enter the IP (or Discover) |
| Connection timeout — gateway unreachable or tunnel slot busy? | Gateway unreachable, or all tunnel slots taken | Check IP/port and the network; free a slot (Tunnel slots block) or switch to Routing |
| Daemon started, but gateway %s is unreachable | The daemon runs but does not reach the bus | Gateway powered on? IP reachable (ping)? In Secure: does the keyring match this gateway? |
| Unable to connect to the daemon on port… | Daemon stopped or local socket port busy | Start the daemon; in case of conflict, change the Socket port (Daemon tab) |
| Unable to start the KNX daemon (30 s timeout) | The process does not answer at launch | Check the daemon logs; check the dependencies (Health page) |
KNX IP Secure
| Message | Cause | Solution |
|---|---|---|
| KNX Secure mode: import a .knxkeys file or enter manual credentials | Secure mode without authentication | Security tab → import the .knxkeys (recommended) or enter User ID + passwords |
| KNX Secure mode with manual credentials: the tunnel individual address is mandatory | Manual credentials without a specified slot | Fill in the tunnel individual address (xknx cannot negotiate it alone without a keyring) |
| Your installation uses KNX Secure, but the “…” mode is not secure | Secure detected but a non-encrypted mode chosen | Switch to TCP Secure Tunneling or Secure Routing |
| SessionResponse MAC verification failed (logs) | The keyring does not match the gateway (device auth / password) | Re-export the .knxkeys from ETS for this installation; check the export password |
| .knxkeys file not found / invalid (malformed XML) | File missing or corrupt | Re-import the file; check it comes from an ETS export |
States not coming back
| Symptom | Likely cause | Solution |
|---|---|---|
| The state never updates | The info command does not carry the right state GA (ga_state) |
Check the state GA on the device page; watch it in the Bus Monitor |
| The state is empty at startup but updates after an action | FlagInit inactive |
Enable Initialize on the info command |
| The device never reports spontaneously | Appliance that does not broadcast its state | Enable cyclic reading (interval ≥ 10 s) on the info command |
| Connected to the KNX bus missing on the Health page | No recent heartbeat (> 90 s) or daemon not connected to the bus | Test the connection; let automatic reconnection do its job |
DPT / badly decoded values
| Symptom | Cause | Solution |
|---|---|---|
Off value (e.g. 5504 instead of 21.5) |
Command DPT ≠ real DPT of the GA | Align the DPT (see DPT reference); compare in the Bus Monitor |
| Right value, wrong unit (%/°C/…) | Subtype/unit derived from an imprecise DPT | Pick the exact DPT (e.g. 9.001 for a temperature) |
| Shutter: position shown inverted | Manufacturer’s 0 %/100 % convention | Read 0 % = open or closed depending on the device (not a DPT problem) |
ETS import
| Message | Cause | Solution |
|---|---|---|
| No address extracted… decryption requires the daemon | Password-protected ETS project | Start the daemon (connection configured), then re-run the analysis; enter the ETS password |
| Extension not allowed / No file received | Wrong file dropped | Drop a valid .knxproj (project import) or .knxkeys (Security) |
| Unable to analyze the project (PHP parser missing or empty result) | Neither daemon nor PHP parser usable | Start the daemon; check the file is not corrupt |
FAQ
Which connection mode should I choose? An IP gateway/interface → UDP Tunneling (simplest). Unstable link / VPN → TCP Tunneling. An IP router and/or several simultaneous supervisors → Multicast Routing. KNX Secure installation → the matching Secure variant.
Is an ETS project mandatory? No, but strongly recommended: the import retrieves all group addresses and their DPTs, and enables automatic creation. Without a project, you enter the GAs by hand.
My ETS project is password-protected. Decryption goes through the daemon: start the daemon (connection configured) before running the analysis, and enter the ETS password in the Project tab.
“Tunnel slot busy” — what should I do? A gateway has a limited number of tunnel slots. Open the Tunnel slots block: Release a busy slot, or Use a free slot. Otherwise, close ETS/another supervisor, or switch to Routing (no slot).
Can I keep ETS connected at the same time as Jeedom? In tunneling, each one consumes a slot (mind the limit). In Routing, as many clients as you want.
A device’s state does not come back. In order: does the info command carry the right state GA? Is the Initialize flag active? Does the appliance report spontaneously (otherwise → cyclic reading)? Check it all in the Bus Monitor.
A value shows incorrectly (weird number, wrong unit). This is a DPT problem: it must match the GA’s DPT in ETS. See DPT reference and the Bus Monitor diagnostic method.
Can I drive a USB / TPUART interface?
No: knxSecure only speaks KNX/IP. Use the eibd plugin, or expose your interface through an external knxd then point knxSecure at it in Tunneling (127.0.0.1:3671).
I come from the eibd plugin, do I have to recreate everything? No: use the EIBD Migration (see above). It recreates the devices while keeping GAs and commands, without deleting the old ones.
Where do I see what is really happening on the bus? The Bus Monitor: it is the central diagnostic tool (real-time telegrams, decoded values, filters, CSV export, test sending).
The plugin logs? Log level adjustable on the Jeedom side, and a built-in daemon log viewer (detailed messages on the Python side, including xknx/Secure errors).